


Recovery and Risk Define the Transit Bus Market in 2025
A 5% rise in deliveries and a surge in zero-emission buses signaled progress in 2025, but high costs, long lead times, and shifting funding priorities continue to cloud the outlook.
April 20, 2026

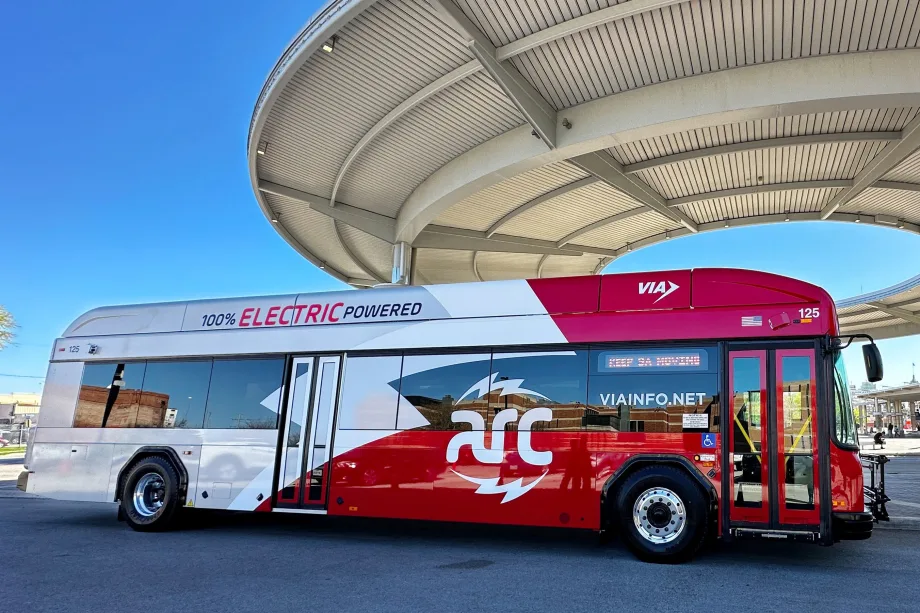
Transit agencies began scaling back zero-emission bus procurements in 2025, as cost, operational challenges, and funding concerns pushed many to reconsider their plans.
Credit:
VIA
6 min to read
- The transit bus market experienced a 5% increase in deliveries in 2025.
- There was a notable rise in the adoption of zero-emission buses, highlighting a shift towards sustainable transportation solutions.
- Despite these advancements, the industry faces challenges such as high costs, extended lead times, and changing funding priorities.
*Summarized by AI
In 2025, the North American transit bus supply continued its slow, steady pace toward stabilization. Overall volumes increased slightly by 5%, and the tier one component suppliers have more or less stabilized, save for the passenger seat segment, which still exhibited issues in 2025.
Most notably, zero-emission equipment became the predominant powertrain for deliveries in 2025, with volumes almost doubling from 2024 and representing a 35% share of overall volumes.
New OEMs Enter as Costs Climb and Zero-Emission Momentum Slows
Two major OEMs (New Flyer and Gillig) remain dominant, but two additional OEMs are expected to enter the market in 2026 — Solaris and ENC.
Solaris will begin deliveries of some of its low-volume orders as it enters the U.S. market, and ENC will begin low-volume deliveries as it transitions from the prior REV ownership to the new Rivaz ownership group.
Beyond the volumes and propulsion changes in 2025 that will be discussed below, pricing, tariff impacts, and lead times for new buses tended to dominate the discussion during the year.
Pricing for new buses has reached all-time highs across all propulsion types, with hybrid and zero-emission variants well over $1 million. CNG bus prices are approaching or exceeding $1 million, while diesel units are well into the $700,000 to $800,000 range. These prices are 30% to 40% higher than they were just five years ago.
The U.S. tariff merry-go-round was a minefield for both OEMs and transit agencies in 2025 as major swings and rate changes dominated the landscape throughout the year.
Given the reduced number of OEMs in the market, lead times for new buses remain in the two-year-plus range, up from the traditional 12 to 18 months that typified lead times when there were more suppliers.
The entrance of additional OEMs, as noted above, may impact this situation in the coming few years as the market returns to a more traditional three to four OEMs serving it.
Zero-emission propulsion bus procurements began to pause or retrench in 2025, as operational issues, costs, and funding prompted many transit agencies to reconsider their zero-emission plans in favor of more stable powertrain choices.
Recent Lo-No grants from the federal government allocated no funding to zero-emission buses, indicating the new administration's direction to favor more traditional, reliable propulsion types in its funding priorities.
Notably, New Flyer announced the largest recall in recent memory for its battery-electric buses, requiring replacement of the energy storage or battery systems on model year 2019-2025 buses at a cost of $230 million.
We’ll see how this dynamic plays out, as zero-emission equipment is currently the highest-volume segment of deliveries in 2025.
Overall, bus deliveries increased by 243 units, from 4,447 in 2024 to 4,690 in 2025, for a 5% year-over-year increase, making 2025 the third consecutive year of market-delivery increases.
Credit:
Trinity Metro
Overall Assessment: Transit Bus Market Rebounds but Remains Below Historic Norms
The following is our analysis of 2025 transit bus deliveries in North America.
Overall, bus deliveries increased by 243 units, from 4,447 in 2024 to 4,690 in 2025, for a 5% year-over-year increase, making 2025 the third consecutive year of market-delivery increases.
Notwithstanding, the market is still lagging the historical long-term average annual delivery levels of 5,500 units. As additional OEMs enter the market in the coming few years, we expect delivery levels to exceed 5,000 units and approach the long-term market average.
Transit Vehicle Length Assessment
Units By Size | 2024 | 2025 | 2025 vs 2024 (Units) | 2025 vs 2024 (%) |
|---|---|---|---|---|
30 Feet and Under | 160 | 110 | -50 | -31% |
35- to 40-Feet | 3,706 | 4,090 | 384 | 10% |
45 Feet | 100 | 165 | 65 | 65% |
60 Feet | 481 | 325 | -156 | -32% |
TOTAL | 4,447 | 4,690 | 243 | 5% |
- Overall, 35- to 40-foot units made up the majority of deliveries in 2025, which was a repeat of prior years, with 4,090 units delivered representing 87% of all deliveries. This compares with 83% of total deliveries in this length segment in 2024, indicating the operating agencies' preference for standard-length vehicles.
- 30-foot and under units experienced another year of decline, with only 110 units being delivered, down from 160 units in 2024 and 214 units in 2023. This sharp decline raises questions about the segment's viability, as it now represents only 2% of total deliveries.
- 45-foot units experienced a 65% increase in 2025 from 2024 to a total of 165 units vs. 100 units in 2024.
- 60-foot units exhibited a decrease of 156 units in 2025 to 325 units vs 481 units in 2024. Again, with only two OEMs offering this option and only a subset of agencies operating articulated buses, the segment is traditionally expected to account for only 5% to 10% of total deliveries.
Propulsion Segmentation Assessment
As noted above, many agencies paused some of their zero-emission plans, but 2025 deliveries showed a marked increase in zero-emission equipment, with volumes almost doubling from the prior year, primarily due to the OEMs' order backlog from procurements over the past two to three years.
Propulsion Catalog | 2024 | 2025 | 2025 vs 2024 (Units) | 2025 vs 2024 (%) |
|---|---|---|---|---|
Diesel | 2,090 | 1,584 | -506 | -24% |
Hybrid | 760 | 697 | -63 | -8% |
Natural Gas | 732 | 772 | 40 | 5% |
Zero Emissions (Electric, Fuel Cell) | 865 | 1,637 | 772 | 89% |
TOTAL | 4,447 | 4,690 | 243 | 5% |
We will see whether the trend toward zero-emission deliveries continues in 2026, despite some agencies retreating from this powertrain option. Notwithstanding, 2025 is the first year in history in which zero-emission propulsion was the largest-volume segment, outpacing diesel propulsion.
- Diesel propulsion deliveries decreased substantially from 2,090 units in 2024 to 1,584 units in 2025, representing a 24% decline.
- Hybrid propulsion saw only a minor decline in 2025 vs. 2024, reaching 697 units. This was a 63-unit, or 8%, reduction from 2024’s volume of 760 units.
- Natural gas fuel propulsion had a nominal 5% increase, moving from 732 units in 2024 to 772 units in 2025. Natural gas variants still accounted for a stable 16% of overall market volumes, unchanged from 2024.
- Zero-emission buses (comprising battery electric and fuel cell buses) were 1,637 units in 2025 vs 865 units in 2024, representing a massive increase of 865 units or 89%. As noted above, this is the first year in history where zero-emission equipment was the market propulsion leader.
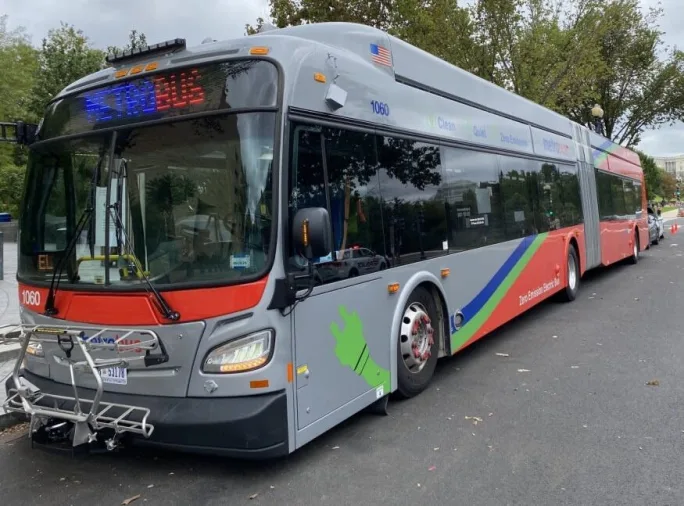
The funding landscape for transit agencies is one of the biggest unknowns, with the U.S. administration having a “hot-cold’ relationship with public transit, including the preference for more traditional powertrain choices over zero-emission buses.
Credit:
WMATA/New Flyer
Transit Bus Market Poised for Growth Amid Funding Uncertainty
In calendar year 2025, transit bus deliveries increased by 5%, with zero-emission variants accounting for the largest share of deliveries for the first time in history. Market volumes still lag the long-term average, but with new OEMs entering the market and supply bases stabilizing, 2026 may well see the market exceed 5,000 units for the first time in six years.
The funding landscape for transit agencies is one of the biggest unknowns, with the U.S. administration having a “hot-cold’ relationship with public transit, including the preference for more traditional powertrain choices over zero-emission buses.
Further, virtually all agencies are facing critical budget shortfalls, casting doubt on their ability to support future bus purchases.
As the industry moves into the second half of the decade, conditions appear to be stabilizing, though notable uncertainties remain. How those forces play out in 2026 will help determine whether this period of relative stability becomes the new normal.
**Source: METRO Magazine, based on numbers reported by participating suppliers, with some numbers projected.
Quick Answers
The transit bus market saw a 5% increase in deliveries and a significant rise in zero-emission buses in 2025.
*Summarized by AI
Subscribe to Our Newsletter
More Bus
More Than a Summer Job: Building the Next Generation of Transit Talent
The Delaware River Port Authority and PATCO have transformed their internship program into a hands-on professional development experience that introduces students to the breadth of transportation careers — and creates a pipeline for future employees.
Read More →
LA Metro Board Awards 220 Battery-Electric Bus Contract to ENC
The contract, which is the largest base award of battery-electric buses by a U.S. transit agency, will be built in Southern California, sustaining good jobs as LA prepares to welcome the world in 2028
Read More →
Public Transit Conference Returning to GFX in 2027, Call for Papers Now Open
The Call for Papers is now open, allowing transit agency professionals and industry experts to help shape the PTC educational program by submitting session ideas for consideration.
Read More →
Indian River Transit’s Community-Focused Approach Earns National Recognition
Named APTA’s 2026 Outstanding Public Transportation System in its size category, Florida’s Indian River County transit system continues to grow ridership through fare-free service and a focus on evolving community needs.
Read More →
ENC Lands MATA Contract and More in Biz Briefs
In this edition of Biz Briefs, we spotlight the latest developments shaping the future of mobility.
Read More →
From Surviving to Thriving: Building Stronger Transportation Organizations
Bus Business Consultants founder Brian Dickson shares lessons on leadership, organizational health, and creating options for long-term success in a changing transportation industry.
Read More →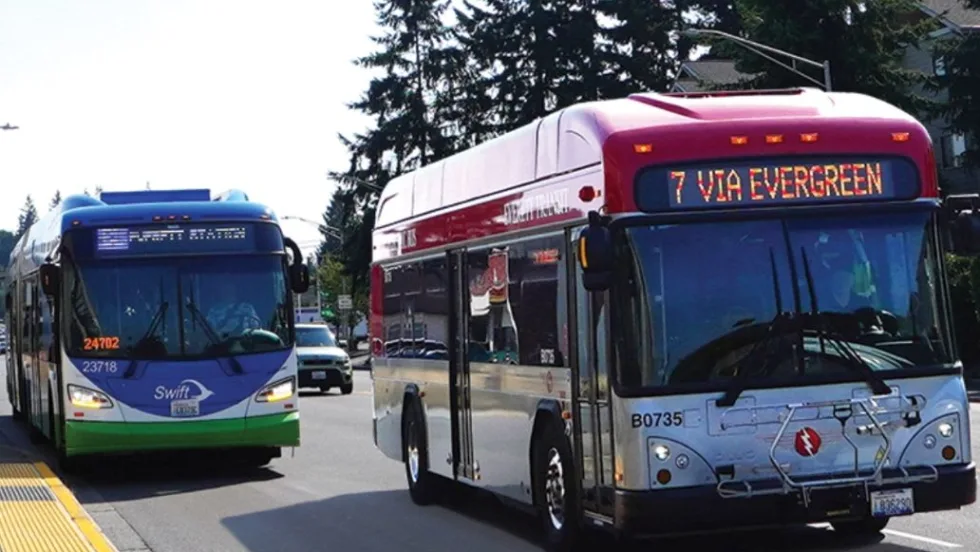
Everett Transit, Community Transit Outline Consolidation Agreement
The proposed agreement calls for a 50% increase in bus service in Everett, a new microtransit zone, continued paratransit service, and the transfer of Everett Transit operations to Community Transit.
Read More →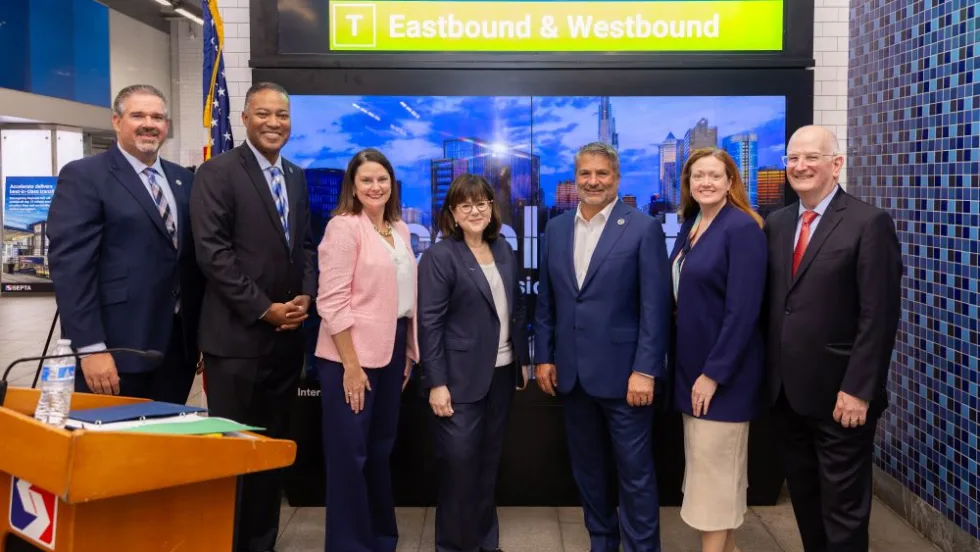
SEPTA Details Accelerate Vision for Transit System
The plan outlines investments in trolley modernization, new Metro and Regional Rail vehicles, accessible stations, and more frequent bus and rail service.
Read More →
Report: Transit Bus Manufacturing Supports 34,100 Jobs, $5.1B in GDP
The “Buses Mean Business” report examines the transit bus manufacturing industry’s economic footprint, supply chain, and rising demand for vehicle replacements.
Read More →
Biz Briefs: New Flyer Delivers in Columbus, Houston, Beep and Freebee Merge, and More
In this edition of Biz Briefs, we spotlight the latest developments shaping the future of mobility.
Read More →