



Video Surveillance in Public Transit: What Riders Really Think
Best and Worst U.S. Cities for Public Transportation in 2026
A new analysis of 50 major U.S. urban areas ranks public transit systems based on accessibility, affordability, usefulness, and safety, highlighting where transit performs best and where challenges remain.
November 12, 2026

ConsumerAffairs evaluated the 50 most populous U.S. urban areas using 2024 data from the Federal Transit Administration's National Transit Database and the U.S. Census Bureau.
Credit:
Jackson Howes via Pexels
4 min to read
- A new analysis evaluates public transit in 50 major U.S. urban areas based on key factors such as accessibility, affordability, usefulness, and safety.
- The report identifies which cities excel in providing effective public transportation systems and which cities face ongoing challenges.
- Findings highlight the varied performance of transit systems across the U.S., indicating areas where improvements are needed.
*Summarized by AI
San Francisco-Oakland, California, ranks as the best U.S. urban area for public transportation, while Oklahoma City, Oklahoma, ranks last, according to a new analysis from ConsumerAffairs.
The 2026 study evaluated the 50 largest U.S. urban areas using federal data on transit usefulness and accessibility, affordability, and operational safety.
New York-Jersey City-Newark, Washington-Arlington, Seattle-Tacoma, and Salt Lake City rounded out the top five, highlighting differences in how transit systems perform across ridership, accessibility, and operating conditions.
Which U.S. Cities Have the Best Public Transportation?
The five highest-ranked urban areas for public transportation in the ConsumerAffairs analysis are:
- San Francisco-Oakland, California
- New York-Jersey City-Newark, New York and New Jersey
- Washington-Arlington, D.C., Virginia, and Maryland
- Seattle-Tacoma, Washington
- Salt Lake City, Utah
San Francisco-Oakland secured the top position with strong ridership, accessibility, and operational safety results. The average resident boarded public transit approximately 83 times annually, the second-highest rate among the urban areas studied.
The region also reported that 97% of its transit stations comply with the Americans with Disabilities Act (ADA), compared with approximately half of stations in New York.
New York-Jersey City-Newark ranked second overall but led the country in transit usage. Residents averaged approximately 186 transit boardings annually, more than double the rate recorded in San Francisco-Oakland. However, the region ranked outside the top 20 for both affordability and operational safety.
Washington-Arlington placed third, with approximately 59 annual boardings per resident and 100% ADA compliance among its transit stations.
Seattle-Tacoma ranked fourth, supported by high ridership and passenger miles traveled, while Salt Lake City rounded out the top five with relatively strong transit usage and lower average fares.
Which U.S. Cities Have the Worst Public Transportation?
Oklahoma City ranked last among the 50 urban areas evaluated, recording the lowest usefulness and accessibility score in the study.
Residents averaged approximately 3.4 transit boardings in 2024, although the area reported full ADA compliance among its transit stations and an average fare of approximately 62 cents per boarding.
The 10 lowest-ranked urban areas were:
- Oklahoma City, Oklahoma
- Jacksonville, Florida
- Buffalo, New York
- Indianapolis, Indiana
- Columbus, Ohio
- Memphis, Tennessee, Mississippi, and Arkansas
- Virginia Beach-Norfolk, Virginia
- Orlando, Florida
- Cleveland, Ohio
- Louisville/Jefferson County, Kentucky and Indiana
The study also identified affordability and safety challenges among several lower-ranked areas.
Buffalo recorded the highest ridership per resident among the bottom 10 but had the least affordable transit relative to commuter earnings. Estimated annual fares accounted for 3.1% of median earnings among transit commuters, the highest share in the analysis.
Memphis, meanwhile, recorded the highest rate of injuries and fatalities associated with major transit safety and security events among the areas studied, despite relatively low fares.
What Separates the Top-Ranked Transit Systems?
The findings suggest that ridership alone does not determine an urban area's overall public transit ranking.
New York recorded the highest transit usage in the country but finished behind San Francisco-Oakland because of differences in accessibility, affordability, and operational safety.
Similarly, lower fares did not necessarily translate into stronger overall performance. Oklahoma City reported relatively inexpensive transit fares but ranked last because of its low usefulness and accessibility score.
Population size also did not consistently correspond with higher rankings.
Miami and Houston, two of the nation's largest urban areas, ranked 18th and 33rd, respectively, while smaller areas such as Salt Lake City and Portland, Oregon, placed among the top 10.
The Western U.S. accounted for six of the 10 highest-ranked urban areas, more than any other region.
How Were the Public Transportation Rankings Determined?
ConsumerAffairs evaluated the 50 most populous U.S. urban areas using 2024 data from the Federal Transit Administration's National Transit Database and the U.S. Census Bureau.
The study assigned scores across three weighted categories:
- Usefulness and accessibility (50 points): Transit boardings per resident, passenger miles traveled per resident, and the percentage of ADA-compliant transit stations.
- Affordability (25 points): Estimated annual transit fares as a percentage of median earnings among public transit commuters.
- Operational safety (25 points): Collisions, derailments, fires, and injuries or fatalities associated with major transit safety and security events, measured relative to vehicle miles traveled.
Each urban area received a combined score out of 100 points, with higher scores indicating stronger performance across the evaluated measures.
Because the analysis combines several metrics, an urban area may rank highly in one category while performing less favorably in another. The rankings also do not directly measure every aspect of the rider experience, such as service frequency or on-time performance.
Although the findings were published in 2026, the underlying metrics reflect 2024, the latest year of data available for the study.
Editor’s Note: The findings offer a more recent perspective on a topic METRO previously explored in its 2020 coverage of the best and worst U.S. cities for commuting by public transportation. Since the two studies use different methodologies, their rankings are not directly comparable.
Quick Answers
The analysis evaluated public transportation systems based on accessibility, affordability, usefulness, and safety.
*Summarized by AI
More Management
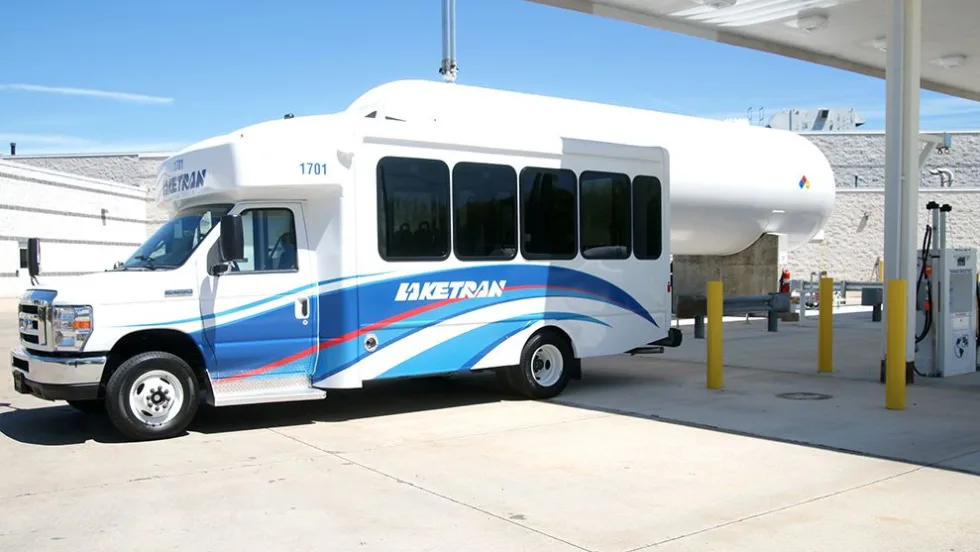
Laketran Cuts Fuel Costs, Boosts Efficiency with Propane-Powered Fleet
The Ohio transit agency is using propane-powered vehicles and on-site fueling infrastructure to cut fuel and maintenance costs while meeting growing demand for paratransit services.
Read More →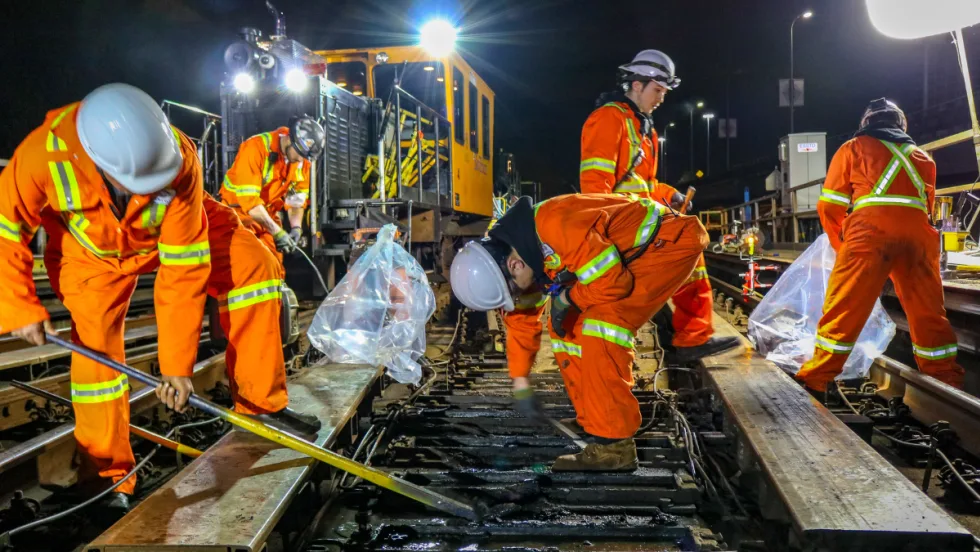
Canada’s Public Transit Supports $65.6 Billion in Annual GDP
New research from the Canadian Chamber of Commerce examines transit's economic contributions, including job creation and the financial implications of transportation investment.
Read More →
Pierce Transit Moves to Expand Fleet Following Proposition 1 Approval
The agency authorized the purchase or refurbishment of up to 60 buses to support a 47% service expansion, as voters nationwide approved billions in new transit funding.
Read More →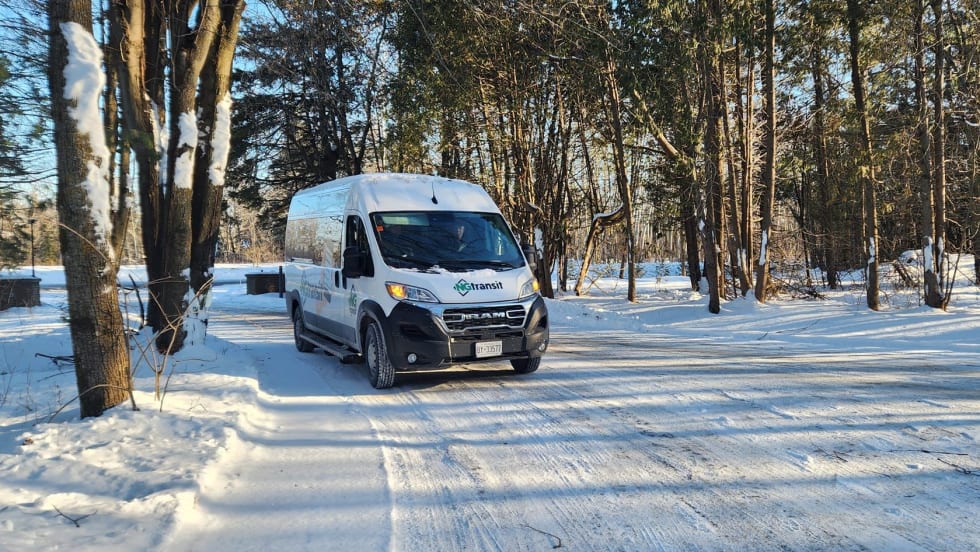
Right-Sizing Rural Transit: Lessons from North Grenville’s On-Demand Model
A small municipality shows how flexible service, rider needs, and public accountability can expand mobility with limited resources.
Read More →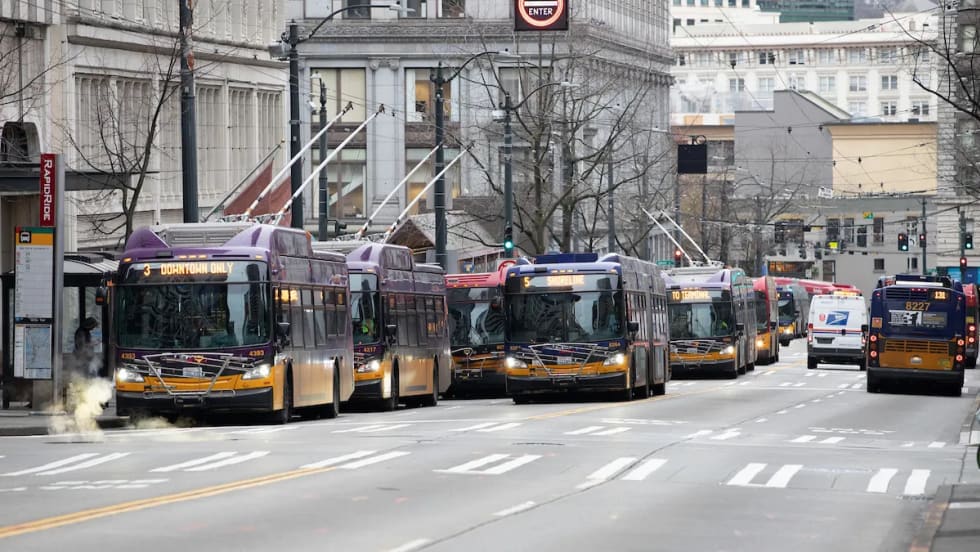
Transit Ballot Victories Signal Strong Voter Support: What Comes Next?
Voters approved billions in public transportation investments in 2026, giving agencies opportunities to preserve service, expand operations, and strengthen regional connections amid a changing political landscape.
Read More →
Transit Expands Agency Partnerships, Reaching 200 Official App Partners
COO Jake Sion discusses Transit’s growth, the success of its Transit Royale program, and how technology is helping agencies improve the rider experience.
Read More →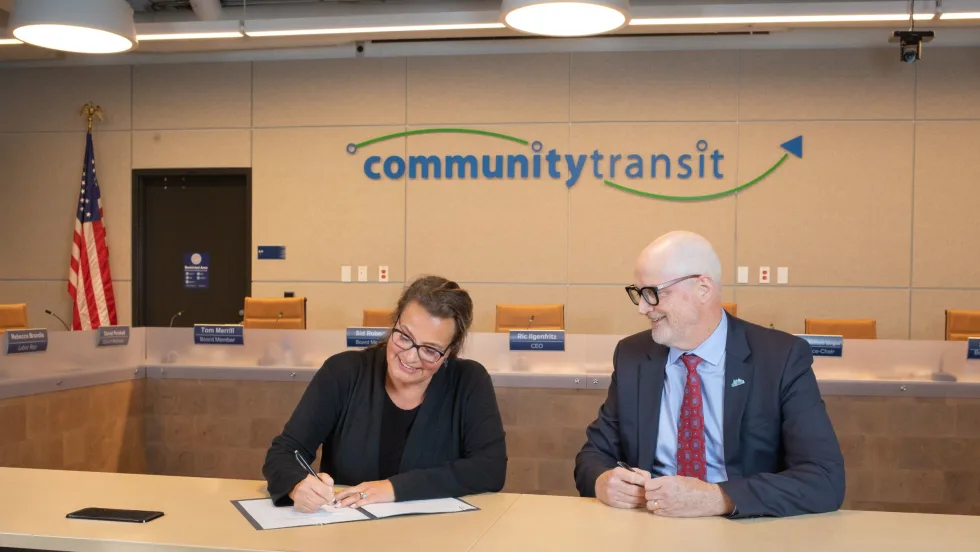
Everett Transit, Community Transit Approve Consolidation of Services
The agreement will bring Everett Transit into Community Transit’s network in April 2027, with plans to increase bus service by 50% by 2031 and expand regional connections.
Read More →
NITA Proposes $5B Operating Budget, $9.7B Capital Program for 2027
The proposed budget includes funding for expanded transit service, safety initiatives, fleet upgrades, and infrastructure improvements across CTA, Metra, and Pace.
Read More →
Financing, Fleet Replacement Requires a More Strategic Approach
Executives from ABC Companies and MCI discuss how rising costs, changing market conditions, and post-pandemic challenges are prompting motorcoach operators to rethink financing strategies, fleet replacement cycles, and long-term planning.
Read More →
Bringing Austin’s First Light Rail System to Life
Austin Transit Partnership CEO Greg Canally discusses the city's nearly 10-mile light rail project, its collaborative approach to project delivery, the importance of community engagement, and the milestones ahead as construction approaches in 2027.
Read More →