
Record 10.8 billion trips taken on public transit in 2014
Annual public transit ridership, the highest number in 58 years, increased even when gas prices declined by 42.9 cents in the fourth quarter.

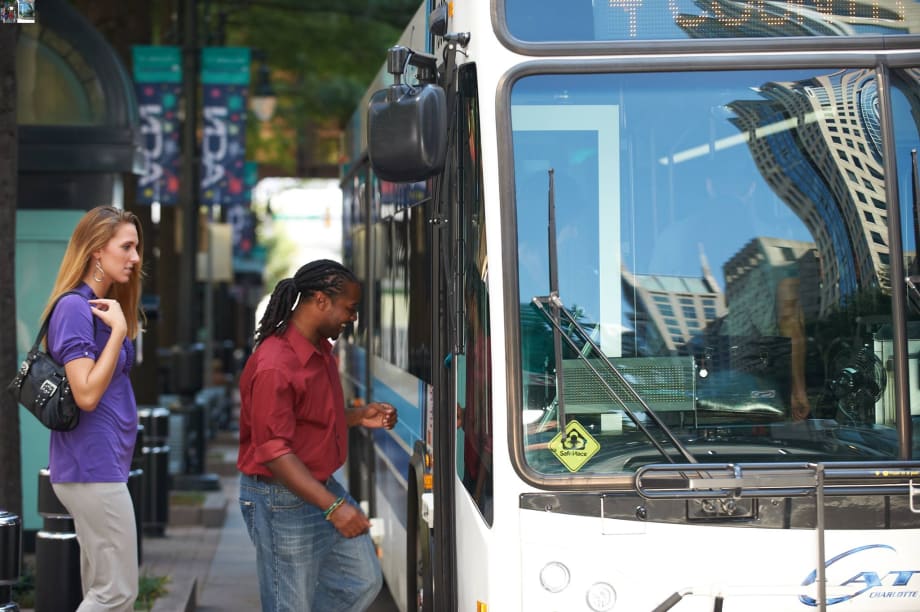
CATS Charlotte Area Transit System
Americans took 10.8 billion trips on public transportation in 2014, which is the highest annual public transit ridership number in 58 years, according to a report released Sunday by the American Public Transportation Association (APTA).
"In 2014, people took a record 10.8 billion trips on public transportation — the highest annual ridership number in 58 years," said Phillip Washington, APTA chair and CEO/GM of the Regional Transportation District in Denver. "Some public transit systems experienced all-time record high ridership last year. This record ridership didn't just happen in large cities. It also happened in small and medium size communities."
Some of the public transit agencies reporting record ridership system-wide were located in the following cities: Albany, N.Y.; Boston; Canton, Ohio; Columbus, Ohio; Denver; Indianapolis; Madison, Wis.; Minneapolis; Olympia, Wash.; Orlando, Fla.; St. Petersburg, Fla.; Riverside, Calif.; Salt Lake City; San Francisco; Seattle; Spokane, Wash.; Tampa, Fla.; and Wenatchee, Wash.
RELATED:Super Bowl contributes to record Valley Metro ridership
Noting that public transit ridership increased even when gas prices declined by 42.9 cents in the fourth quarter, APTA President/CEO Michael Melaniphy said, "Despite the steep decline in gas prices at the end of last year, public transit ridership increased. This shows that once people start riding public transit, they discover that there are additional benefits besides saving money."
"People are changing their travel behavior and want more travel options," said Melaniphy. "In the past people had a binary choice. You either took public transit, most likely a bus, or you drove a car. Now there are multiple options with subways, light rail, streetcars, commuter trains, buses, ferries, cars and shared use vehicles."
Another reason behind the ridership increases is the economic recovery in certain areas. For example, Atlanta, San Francisco, Minneapolis, Seattle, and Champaign-Urbana (Ill.) were some cities that saw increased ridership in part because of an improved job market.
RELATED:Public transportation users save $9,238 annually
"Since nearly 60 percent of the trips taken on public transportation are for work commutes, public transportation ridership increases are seen in areas where the local economy is growing," said Melaniphy.
"Expanded and improved public transit services also played a role in attracting more riders," said Melaniphy. "For example, the transit agencies in Albany (N.Y.), Denver, Indianapolis, Riverside (Calif.), and Salt Lake City saw increased ridership due to greater service."
From 1995 to 2014 public transit ridership increased by 39%, almost double the population growth, which was up 21%. The estimated growth of vehicle miles traveled (VMT) was 25%. (It is estimated because the December VMT has not yet been posted by the Federal Highway Administration.)
Pointing out that the current federal surface transportation bill expires on May 31, Melaniphy said, "The record ridership in 2014 is a clear message to Congress that the citizens of this country want expanded public transit services. Congress needs to work together now to pass a long-term, well-funded surface transportation bill that invests in our country's public transit infrastructure. This is critical not only to the millions of Americans who use public transportation, but is also crucial for our country's economic competitiveness."
2014 Ridership Breakdown
Light rail (modern light rail, streetcars, trolleys, and heritage trolleys) ridership increased 3.6% in 2014 with 16 out of 28 public transit systems reporting increases. Light rail in Minneapolis showed a significant increases of 57.4% due to the opening of the METRO Green Line in Minneapolis. Light rail ridership in Oceanside, Calif. increased by 36% due to the system being shut down for several months in 2013. Four light rail systems saw double digit increases in 2014 in the following cities: Houston (17.9%); San Diego (15.3%); Denver (12.0%); and Seattle -Sound Transit (11.7%). Light rail ridership in the following cities also saw increases in 2014: San Francisco (7.2%); Salt Lake City (6.0%); Hampton, Va. (5.4%); New Orleans (5.3%); San Jose, Calif. (4.4%); Newark, N.J. (3.4%); Dallas (3.2%); and Charlotte, N.C. (3.1%).
Heavy rail (subways and elevated trains) ridership increased by 3.3% across the country as 8 out of 15 public transit systems reported increases. Heavy rail systems with increases in ridership for 2014 were in the following cities: San Francisco (6.1%); Boston (4.9%); Chicago (4.1%); New York -MTA NYC Transit (4.0%); New York -MTA Staten Island Railway (3.5%); Atlanta (2.3%); and Miami (2.1%).
Nationally, commuter rail ridership increased by 2.9 percent in 2014 as 22 out of 28 public transit systems reported increases. Four commuter rail systems saw double digit increases in 2014 in the following cities: Salt Lake City (16.2%); Stockton, Calif. (15.7%); Seattle -Sound Transit (10.4%); and San Carlos, Calif. (10.1%). Ridership in the following cities also saw increases in 2014: Lewisville, Texas (9.3%); Dallas-Ft. Worth (6.9%); Newark, N.J. (5.4%); Anchorage, Alaska (5.4%); Portland, Ore. (4.7%); Nashville, Tenn. (4.4%); Boston (3.5%); Oceanside, Calif. (3.5%); Oakland, Calif. (2.5%); and Baltimore, Md. (2.2%).
Bus ridership decreased nationally by 1.1%. However, in small and medium size population groups, bus ridership saw percentage increases of 2.0 and 0.5 respectively. The following cities showed the highest large bus ridership increases in 2014: Baltimore, Md. (6.8%); Portland, Ore. (5.3%); Oakland, Calif. (4.2%); San Francisco (3.9%); Columbus, Ohio (3.0%); Atlanta (2.8%); San Diego (2.4%); and Seattle -King County DOT (2.0%).
Demand response (paratransit) ridership increased in 2014 by 0.2%. Trolleybus ridership declined by 2.8% in 2014.
To see the complete APTA 2014 ridership report, go to: http://www.apta.com/resources/statistics/Documents/Ridership/2014-q4-ridership-APTA.pdf
More Management
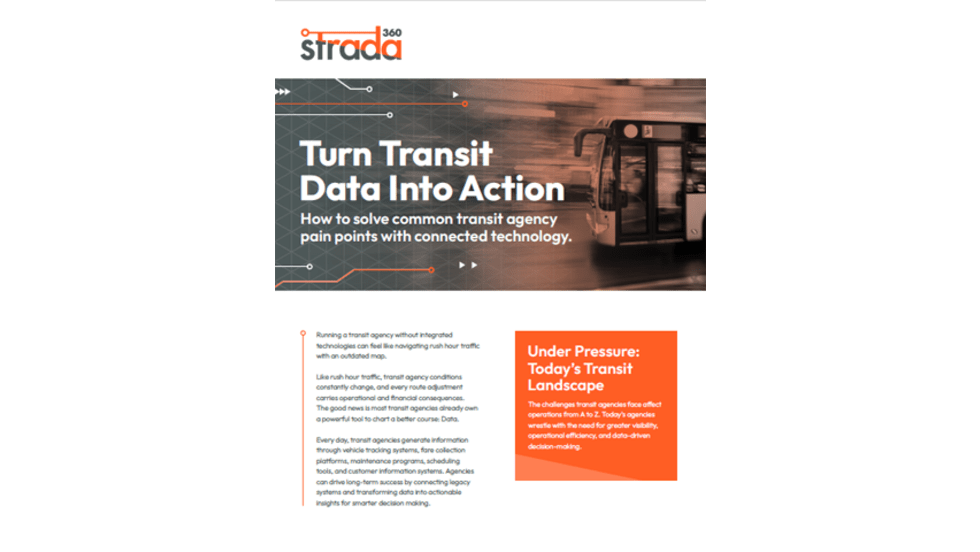
Turn Transit Data Into Action
Discover how leading agencies are using connected technology to gain real-time visibility across operations, improve service reliability, and reduce disruptions.
Read More →
What Transit-Oriented Development Means for the Future of Public Transportation
Once viewed primarily as transit operators, agencies are now leveraging land, partnerships, and long-term planning to boost ridership, expand housing, and strengthen communities.
Read More →
USDOT Announces $22 Million for Transit Innovation, Updates High-Speed Rail Rules
New federal transit funding will support safety, accessibility, and technology projects as updated rail regulations establish new noise standards for high-speed trains.
Read More →
Transportation Construction Coalition Unveils Infrastructure Case Studies Ahead of Federal Funding Deadline
The coalition noted the next surface transportation bill should provide sustained investment in highways and public transit to strengthen freight movement, improve safety, and support economic growth.
Read More →
People Movement: American Bus Association Extends Ferguson and More
METRO’s People Movement highlights the latest leadership changes, promotions, and personnel news across the public transit, motorcoach, and people mobility sectors.
Read More →
METRO Magazine Announces 2026 Innovative Solutions Awards Winners
Projects Recognized for Advancing Mobility Through Technology, Accessibility, Workforce Innovation, and Operational Excellence
Read More →
MBTA Rolls Out Pilot Programs to Cut Costs, Simplify Travel
Three new fare pilots — including unlimited two-hour transfers, reduced express bus fares, and free transit for eligible seniors — will launch this fall as Massachusetts extends popular commuter rail discounts through November.
Read More →
FTA Opens $610 Million Funding Opportunity for Bus Infrastructure Projects
The latest Notice of Funding Opportunity provides transit agencies with funding for bus facilities, fleet modernization, and low- and no-emission vehicles, with applications due September 21.
Read More →Biz Briefs: STV teams with Amtrak, Motorcoach Operators Boost Fleet and Land Contracts, and More
From manufacturers and suppliers to transit agencies and motorcoach operators, these updates offer a snapshot of the projects, partnerships and business moves driving the industry forward.
Read More →
Massachusetts Approves $530M to Strengthen MBTA Operations, Infrastructure
The funding package targets operating stability, capital improvements, and fare affordability, offering a model for agencies navigating long-term funding challenges.
Read More →