San Diego's MTS Survey Shows Strong Customer Satisfaction, High Community Value
The survey, conducted in November 2024 by ETC Institute, a professional market research firm that specializes in customer satisfaction surveys, gathered feedback from more than 3,700 riders across the MTS bus and Trolley light rail networks.
When asked if riders would recommend MTS services to others, 58% of bus riders and 62% of Trolley riders are highly likely to do so.
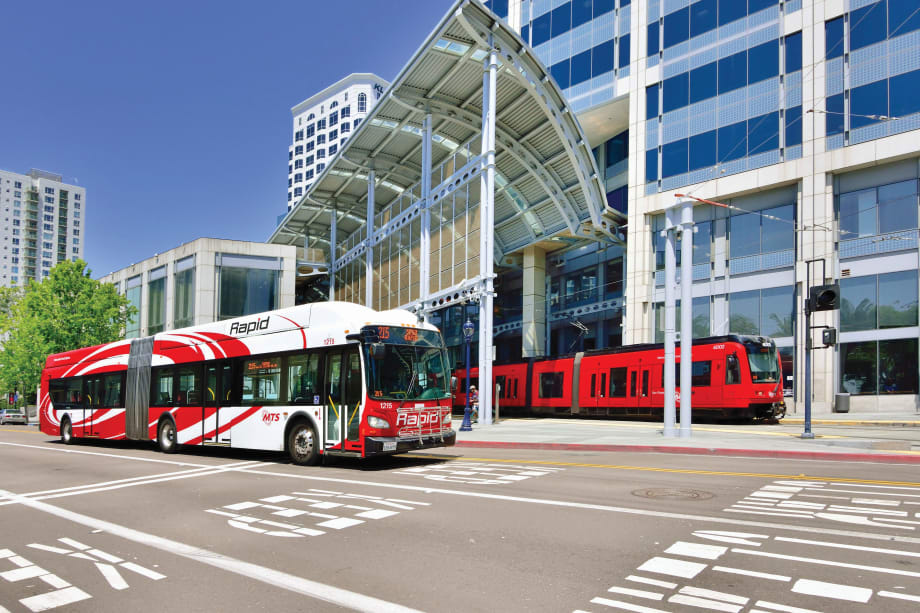
Photo: MTS
2 min to read
The San Diego Metropolitan Transit System (MTS) continues to exceed public transportation industry benchmarks in several key areas of service, including on-time performance, customer satisfaction, community value, and safety, according to the agency’s 2024 Customer Satisfaction Survey.
The survey, conducted in November 2024 by ETC Institute, a professional market research firm that specializes in customer satisfaction surveys, gathered feedback from more than 3,700 riders across the MTS bus and Trolley light rail networks.
Ad Loading...
Results revealed that 83% of bus riders and 82% of Trolley riders are satisfied with the service MTS provides — well above national averages for transit agencies (58%).
“Over the past few years MTS has focused on making improvements to the customer experience for riders, addressing safety, security, cleanliness, service reliability and more,” said Sharon Cooney, MTS CEO. “These results demonstrate that our efforts are working and that’s a testament to a committed team at MTS. Overall we are pleased with the results. It shows that we are responding to what riders are telling us. We will use the data from this survey to continue to get better.”
Survey Highlights
Highlights of the survey include:
High Community Value: 87% of bus riders and 85% of Trolley riders believe MTS provides value to the community.
Recommended Service: When asked if riders would recommend MTS services to others, 58% of bus riders and 62% of Trolley riders are highly likely to do so. MTS’ “Net Promoter Score” (plus 44 for bus, plus 50 for Trolley) is approximately plus 65 and plus 71 points, respectively, higher than the national average (-21).
Reliable Operations: 79% of Trolley riders and 66% of bus riders agree that their vehicle usually runs on time, compared to 48% nationwide.
Important Economic Connector: 61% of Trolley riders and 73% of bus riders use MTS services to get to work or school.
Safety on Board: 71% of bus riders and 63% of Trolley riders feel safe while on board, scoring higher than the national average (42% for bus and Trolley).
Positive Trends: In addition to safety trends, riders were five times more likely to say their satisfaction has improved over the past year (31% bus, 33% Trolley) than decreased (5% bus, 6% Trolley).
While the survey results are overwhelmingly positive, MTS will use this rider feedback to identify areas for improvement.
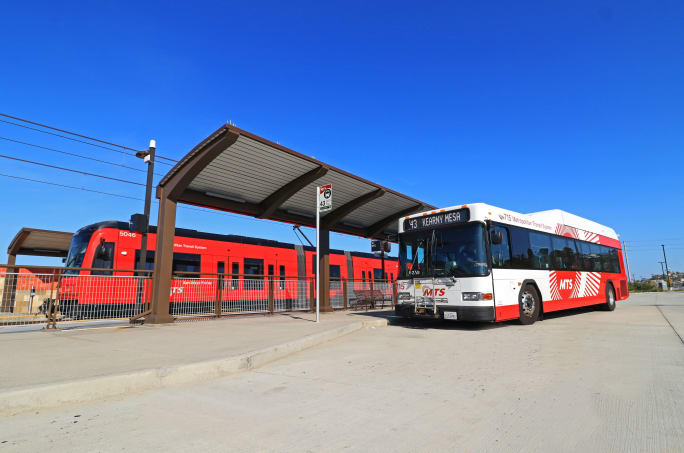
Photo: MTS
Still Looking to Improve
While the survey results are overwhelmingly positive, MTS will use this rider feedback to identify areas for improvement.
Ad Loading...
The most impactful areas, based on rider priorities, include safety while waiting for transit, cleanliness of vehicles and stations, and maintaining timely service.
Through the first eight months of Fiscal Year 2025, ridership is up approximately 8%, and on pace to surpass 80 million trips.
Once viewed primarily as transit operators, agencies are now leveraging land, partnerships, and long-term planning to boost ridership, expand housing, and strengthen communities.
New federal transit funding will support safety, accessibility, and technology projects as updated rail regulations establish new noise standards for high-speed trains.
The coalition noted the next surface transportation bill should provide sustained investment in highways and public transit to strengthen freight movement, improve safety, and support economic growth.
METRO’s People Movement highlights the latest leadership changes, promotions, and personnel news across the public transit, motorcoach, and people mobility sectors.
Three new fare pilots — including unlimited two-hour transfers, reduced express bus fares, and free transit for eligible seniors — will launch this fall as Massachusetts extends popular commuter rail discounts through November.
The latest Notice of Funding Opportunity provides transit agencies with funding for bus facilities, fleet modernization, and low- and no-emission vehicles, with applications due September 21.
From manufacturers and suppliers to transit agencies and motorcoach operators, these updates offer a snapshot of the projects, partnerships and business moves driving the industry forward.
The funding package targets operating stability, capital improvements, and fare affordability, offering a model for agencies navigating long-term funding challenges.
Incoming LA Metro Board Chair and Los Angeles Mayor Karen Bass joined outgoing Board Chair Fernando Dutra and LA Metro CEO Stephanie Wiggins to review accomplishments from fiscal year 2026, which included the opening of new rail extensions, advancement of major transit projects, expanded safety programs, and new rider amenities.