

Keep Reading: New York MTA Seeks Bids for 2,390 Subway Cars in Record-Breaking Order
Manhattan’s Central Business District Travel Climbs to 6.3 Million Daily Trips as Transit Leads Growth
Although volumes remain below pre-pandemic levels, NYMTC’s latest Hub Bound report shows rising transit use, shifting commute patterns, and continued recovery.
April 1, 2026

While travel into the CBD has certainly rebounded since the COVID shutdown, overall volumes remain far below 2019 levels, according to the New York Metropolitan Transportation Council’s annual Hub Bound Travel Data Report.
Credit:
Kayla Linero
3 min to read
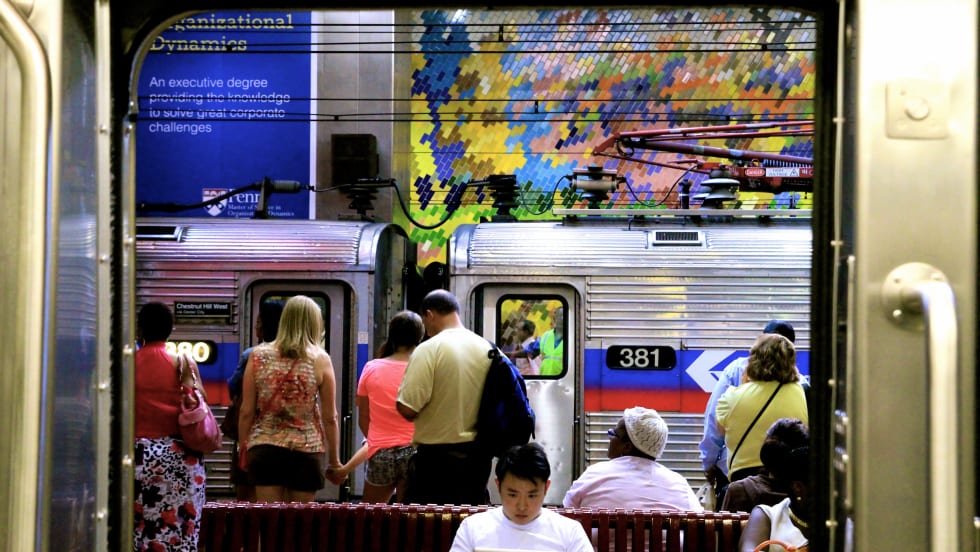
Travel to and from Manhattan’s Central Business District (CBD) is on the rise, but how people are getting there, and when, continues to evolve.
According to the New York Metropolitan Transportation Council’s (NYMTC) annual Hub Bound Travel Data Report, nearly 6.3 million people entered and exited the CBD during a typical weekday in 2024. This total reflects nearly 600,000 more people than in 2023.
Hub Bound tracks the volume of public and private travel on a single day in the CBD, defined as all areas south of 60th Street in Manhattan.
To enter and exit Manhattan’s CBD, roughly 4.6 million people used public transportation, representing a 14.4% increase over 2023 levels. Close to 1.6 million people used autos, taxis, vans, and trucks — a 1.9% decrease from 2023.
Approximately 98,000 daily bicycle trips were recorded, reflecting 1.6% of the mode share and an 18% increase from 2023. Many bicyclists (65%) entered at 60th Street, while 25% crossed into the CBD from Brooklyn and 9% crossed from Queens.
The Roosevelt Island Tramway saw a 34% decline in ridership from 2023, largely due to the resumption of regular F train service, whose disruption had caused a 92% increase in 2023 compared to 2022.
Recovery Continues as Commuting Habits Evolve
While travel into the CBD has certainly rebounded since the COVID shutdown, overall volumes remain far below 2019 levels, when approximately 7.6 million travelers entered and exited the CBD.
However, study analysts speculate that shifts in work-from-home policies may have solidified changes in travel trends.
According to Hub Bound’s findings, MTA NYC Transit subways carried 80% of all rail passengers, while suburban and intercity rail services and express bus ridership made up almost 89% of all bus travel into the CBD. Plus, 84% of bus riders commuted from New Jersey.
Ferry ridership increased by 2.5%, with Staten Island Ferry passengers accounting for 54% of total ferry trips.
Subway Leads as Top Mode Into CBD Amid Rising Demand
In 2024, the busiest morning hour was from 8 a.m. to 9 a.m., with 452,000 entries into the CBD, which is 18.9% higher than in 2023. The evening peak occurred between 5 p.m. and 6 p.m., when 406,000 people exited the CBD, an increase of 12.7% from 2023.
The subway system remained the most popular mode of public transportation in 2024, carrying nearly 3.5 million passengers to and from the CBD in a single day. Suburban and intercity rail trains brought about 307,000 passengers into the CBD on the survey date, accounting for 13% of all public transit passengers. This represents close to 10% of all daily travelers entering the Hub. It was the third most prevalent mode of entry into the Hub after the subway and private motor vehicles.
Since the first Hub Bound survey in 1924, private motor vehicles, including autos, taxis, vans, and trucks, have been the second most common mode of transportation after the subway system. In 2024, about 785,000 people entered the Hub using private motor vehicles. This represents about 15,000 fewer passengers than in 2023.
“This year’s Hub Bound marks 100 years of Hub Bound tracking since the first report was published by the Regional Plan Association in 1924,” said Adam Levine, executive director of NYMTC. “It’s interesting to see how far we’ve come, and how some of the percentages have stayed relatively the same. For certain, many of these statistics will be even more interesting next year when we compare them to statistics gathered during the introductory year of congestion pricing.”
The 2024 Hub Bound Travel Data Report is available for download in Excel and PDF formats at www.nymtc.org under Data and Modeling.
More Management
SEPTA Board Approves FY2027 Budget Amid Funding Challenges
The spending plan represents an increase of just 1.9% over the current year and includes investments in new buses, additional full-length fare gates, and other customer enhancements.
Read More →
North Carolina CATS Approves Fare Modernization, Fare Ambassadors Programs
The initiatives will introduce new payment options, fare capping, and rider education as the Charlotte transit agency looks to simplify fares and improve the customer experience.
Read More →
Executive Order Aims to Improve Transit Access Across California
The order directs state agencies to streamline transit project delivery, improve coordination, and expand access to bus and passenger rail services across California.
Read More →
Microtransit Fare Hikes May Hurt More Than Help, Study Finds
New research suggests raising microtransit fares may drive away the riders agencies need most.
Read More →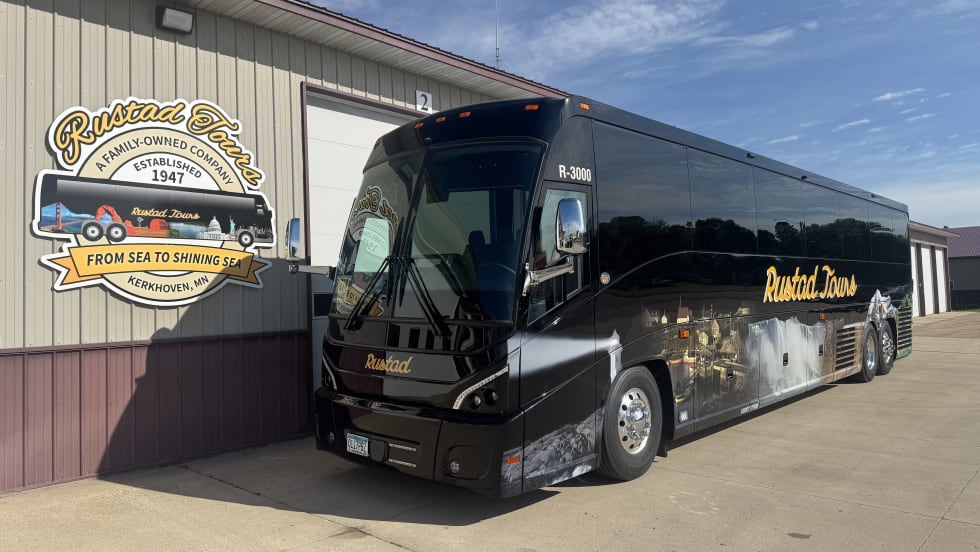
Minnesota's Rustad Tours Takes Delivery of New MCI Motorcoach
The latest addition represents Rustad Tours’ 17th new MCI coach, marking more than four decades of partnership between the two companies.
Read More →Seattle's Sound Transit Refunds Debt, Saving Approximately $23 Million
As part of the debt refunding process, Sound Transit requested that the credit rating agencies rate the new debt issuance along with the current outstanding debt.
Read More →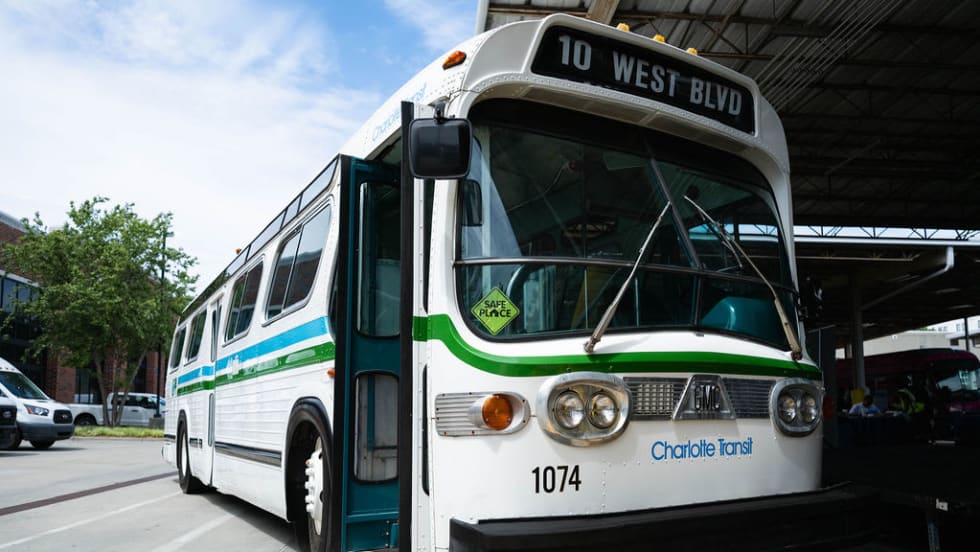
North Carolina’s CATS Celebrates 50 Years of Public Transit
The milestone event honored generations of transit workers and showcased how public transportation has evolved into a multimodal system serving one of the nation's fastest-growing regions.
Read More →
Biz Briefs: Endera Delivers to California, Safety Vision Teams with San Antonio's VIA, and More
From manufacturers and suppliers to transit agencies and motorcoach operators, these updates offer a snapshot of the projects, partnerships and business moves driving the industry forward.
Read More →
Smarter Maintenance Starts with Risk, Not Routine
As infrastructure ages and funding pressures mount, effective asset management is becoming critical to maintaining safe, reliable transportation networks.
Read More →
OCTA Extends Senior Mobility Program Agreements Through 2031
The Measure M-funded program has provided nearly 3.5 million trips and will continue helping thousands of older adults maintain independence and access essential services.
Read More →