L.A. Metro Sees 16th Straight Month of Ridership Growth
Average weekday rail ridership saw a 6.4% increase in boardings over March 2023, surpassing 200,000 boardings for the second time since the beginning of the pandemic.
Metro has updated its monthly ridership numbers dating back to April 2022 to correct a data validation error, which inaccurately counted ridership at an average of 5% lower than actual ridership on Metro’s light rail lines (A, E, L, C and K).
Average weekday rail ridership saw a 6.4% increase in boardings over March 2023, surpassing 200,000 boardings for the second time since the beginning of the pandemic.
Ad Loading...
Metro’s 16-Month Growth
March 2024 marked the 16th consecutive month of year-over-year ridership growth.
In March 2024, Metro had a total of 25,880,698 boardings on its bus and rail services. An average of 955,918 rides were taken each weekday with Saturday boardings averaging 606,255 and Sunday boardings averaging 555,029.
Metro’s March total bus and rail ridership combined was at 81.5% of its March 2019 pre-pandemic level. Total weekend ridership in March was 89.2% of pre-pandemic (March 2019) levels and total March weekday ridership was 79.5% of its March 2019 pre-pandemic level.
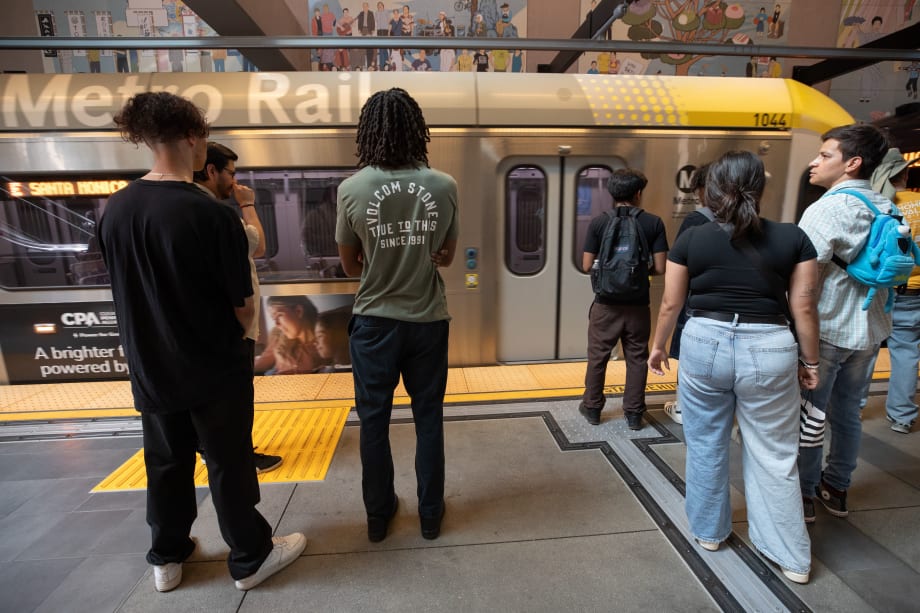
Metro's March Rail Ridership
March 2024 was an impressive month for Metro rail ridership. The new A and E Lines were up 25.6% on weekdays and 26.3% on weekends.
During the month, the light rail A Line saw 1,412,523 total weekday boardings and surpassed the subway B Line, which saw 1,385,496 boardings, as Metro’s busiest weekday rail line. The C Line average weekday ridership was up 22.2% and the K Line also saw a 6.5% increase in average weekday ridership. Total March rail boardings were 5,717,630 with 4,311,720 trips taken on weekdays.
Ad Loading...
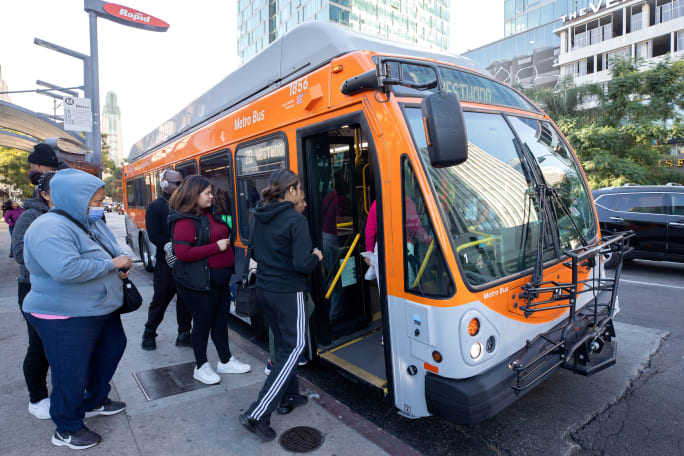
Metro’s March Bus Ridership
Metro bus ridership in March saw an 11.3% year-over-year increase over March 2023. More than 20 million (20,163,068) rides were taken on Metro buses, with total bus ridership in March 2024 at 85.6% of its pre-pandemic (March 2019) level.
Metro recorded an average of 750,598 bus boardings on weekdays in March, an average of 460,779 boardings on Saturdays and an average of 419,323 boardings on Sundays.
Ridership continues to grow as Metro furthers its human-centric, multilayered approach to safety, improved cleanliness, improved reliability, and frequency of service as well as fully restored bus service.
Metro bus ridership in March saw an 11.3% year-over-year increase over March 2023. More than 20 million (20,163,068) rides were taken on Metro buses, with total bus ridership in March 2024 at 85.6% of its pre-pandemic (March 2019) level.
Photo: LA Metro
Leisure Travelers Helping Growth
Weekends continue to show the strongest ridership recovery as leisure travelers are turning to Metro for travel to activities throughout the county. Average boardings on bus and rail combined on Saturdays reached 85.5% of March 2019 levels and on Sundays during the month average combined boardings reached 93.7% of March 2019 pre-pandemic levels.
During March, weekend activities such as the CONCACAF Soccer Championship, the LA Wine and Food Festival, the 96th Annual Academy Awards (Oscars), plus LAFC, Chivas, Clippers, and Dodger fans took advantage of Metro’s service boosting weekend ridership.
Ad Loading...
Fare Programs Making an Impact
Metro also continues to provide programs that make riding more affordable for everyone.
The agency’s reduced-price transit pass programs, such as the student GoPass pilot program, which offers free transit passes to K-12 and community college students, and its Low-Income Fare is Easy (LIFE) program, which provides free rides and reduced fares to low-income customers, are helping those who need it most.
In March, the GoPass Pilot Program saw 1,985,314 total boardings versus 1,771.640 in March 2023, reflecting a 12% year-over-year increase. The LIFE Program observed an 18% year-over-year increase in March ridership with 1,484,150 boardings compared to 1,260,155 in March 2023.
Ridership Calculation Adjustments
Metro has updated its monthly ridership numbers dating back to April 2022 to correct a data validation error, which inaccurately counted ridership at an average of 5% lower than actual ridership on Metro’s light rail lines (A, E, L, C and K).
The error did not affect bus and heavy rail ridership numbers and occurred when manual adjustments were made to Metro’s Automatic Passenger Counting system to account for non-transit activity, such as security personnel, custodians and supervisors helping to clear and clean the trains at the end of the line.
Ad Loading...
During the manual process, some transit passengers were undercounted. Metro has corrected its data validation procedures to account for this error and has added additional validations to avoid such an error occurring again.
The error had no effect on Metro’s operations or finances. Metro discovered this error through a public discussion on Reddit and thanks a devoted transit enthusiast for identifying this issue.
Discover how leading agencies are using connected technology to gain real-time visibility across operations, improve service reliability, and reduce disruptions.
Once viewed primarily as transit operators, agencies are now leveraging land, partnerships, and long-term planning to boost ridership, expand housing, and strengthen communities.
New federal transit funding will support safety, accessibility, and technology projects as updated rail regulations establish new noise standards for high-speed trains.
The coalition noted the next surface transportation bill should provide sustained investment in highways and public transit to strengthen freight movement, improve safety, and support economic growth.
METRO’s People Movement highlights the latest leadership changes, promotions, and personnel news across the public transit, motorcoach, and people mobility sectors.
Three new fare pilots — including unlimited two-hour transfers, reduced express bus fares, and free transit for eligible seniors — will launch this fall as Massachusetts extends popular commuter rail discounts through November.
The latest Notice of Funding Opportunity provides transit agencies with funding for bus facilities, fleet modernization, and low- and no-emission vehicles, with applications due September 21.
From manufacturers and suppliers to transit agencies and motorcoach operators, these updates offer a snapshot of the projects, partnerships and business moves driving the industry forward.
The funding package targets operating stability, capital improvements, and fare affordability, offering a model for agencies navigating long-term funding challenges.