The FTA asks us a gazillion questions in their annual NTD reporting process, nearly all of which relate exclusively to how many miles our buses drove, how many people that bus picked up, and whether we took care of the bus.
The FTA asks us a gazillion questions in their annual National Transit Database (NTD) reporting process, nearly all of which relate exclusively to how many miles our buses drove, how many people that bus picked up, and whether we took care of the bus.
Ad Loading...
Sadly, nowhere do they ask, "did those people you pick up actually like it?”
Tracked over 50 years plus now, the single most significant correlating factor to increased transit ridership is the price of a gallon of gas, 100% out of the transit industry’s control.
There are three factors to the equation: The community finding Value, Happier customers, and More customers.
Serving the Community
Let's start with the people footing the bill: the community.
Our research nationally shows in nearly every American city, fewer than 5% of people use the public transportation system.
Ad Loading...
However, we similarly find that in nearly every city more than 80% of people find value in their public transportation system.
In an industry that can't stop talking about ridership, ridership recovery, and a regulatory body that ties most definitions of value to increased ridership, the communities that actually fund the public transportation system see minimal correlation to the volume argument of simply more ridership.
The top three factors that communities find value in their system are:
Connecting people to jobs.
Providing mobility to low-income families and individuals.
Providing transportation options to people with special mobility needs.
Pleasing Ridership
The second part of the equation is happier customers.
Ad Loading...
And, who gets to decide if they are happy? Simple: the customers themselves.
By empowering customers to pick and prioritize what it takes to make them happy, and then delivering on that, remarkably, customer satisfaction goes up.
And if you like something, the likelihood is you utilize the service more and urge friends and family to do the same.
And while every community is unique, just like each customer, our research nationally shows that on an aggregated basis the top three factors to make a transit customer happy nationally are:
On-time performance
Frequency
Travel Time
Ad Loading...
Since the 1950s, the transit industry has focused almost exclusively on the "more" part of the equation.
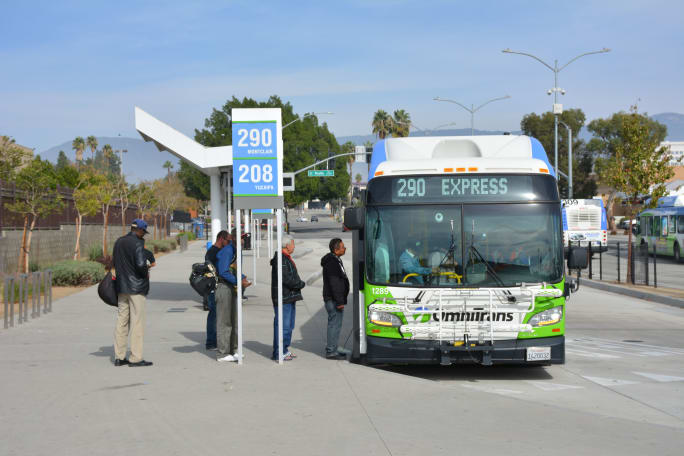
Photo: Omintrans
Increased Ridership
And last (for a reason) is increased ridership.
We've shared previously that, nationally, the income level of a typical transit customer today is 14% lower than it was pre-COVID.
The largest factor for that is remote work. More affluent workers are now working remotely, at least a portion of the time.
That customer, who used to utilize transit, now works at home two days a week, which in turn has decreased transit ridership by 40%.
Despite the decrease, they are still the customer; they just use it less. It's no different than someone trying to reduce their coffee intake: they still stop at Dunkin Donuts, just not as often.
Ad Loading...
We would be well served to listen to the 80% of people in our communities that find value in the public transportation system regardless of ridership levels, as opposed to being consumed with a metric that only we are fascinated with: somehow increasing ridership by 100% and still only serving six to seven percent of the community.
If the choice was to simply double your ridership and celebrate yourself or have the community find value in moving more happy customers, which would you choose?
Our Communities Will Value Happier Customers
Since the 1950s, the transit industry has focused almost exclusively on the "more" part of the equation.
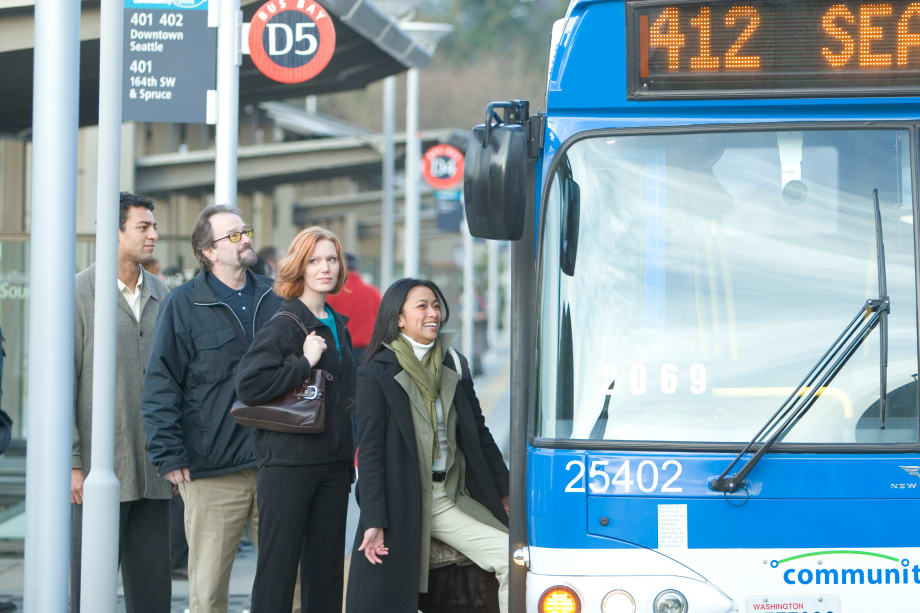
The Federal Transit Administration (FTA) asks a multitude of questions in its annual NTD reporting process. These questions focus almost entirely on metrics like how many miles our buses travel, how many people ride them, and whether the vehicles are maintained.
Yet, one question is glaringly absent: “Did the people you pick up actually enjoy the ride?”
Ad Loading...
Over more than 50 years, data shows the single most significant factor correlating with increased transit ridership is the price of a gallon of gas — something completely outside the control of the transit industry.
The equation we should be focusing on has three components: communities finding Value, creating Happier customers, and attracting More customers.
Value: A Community-Centric Approach
Let’s start with the people funding the system: the community.
National research reveals that in nearly every American city, fewer than 5% of residents regularly use public transportation. Yet, more than 80% of those same communities see value in having a public transportation system.
Despite this, the industry remains fixated on ridership statistics, ridership recovery efforts, and regulatory definitions of success that hinge on increasing ridership.
Ad Loading...
The disconnect is clear: the communities paying for public transit often place little emphasis on ridership volume. Instead, they value the system for its broader impact.
The top three reasons communities find value in their transit systems are:
Connecting people to jobs.
Providing mobility to low-income families and individuals.
Offering transportation options for people with special mobility needs.
In an industry that can't stop talking about ridership, ridership recovery, and a regulatory body that ties most definitions of value to increased ridership, the communities that actually fund the public transportation system see minimal correlation to the volume argument of simply more ridership.
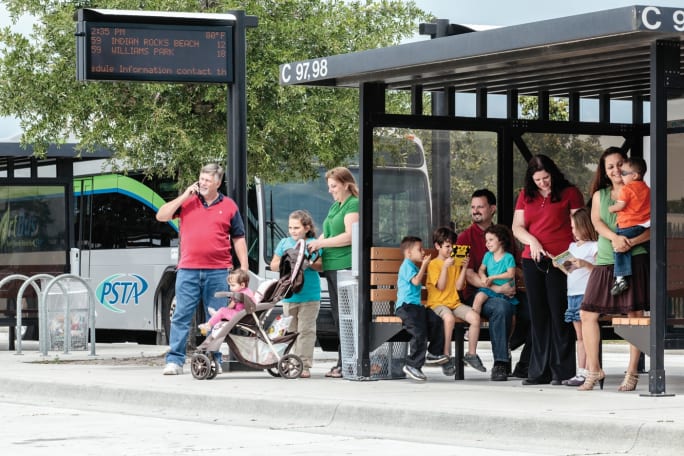
Photo: PSTA
Happier Customers: Listening and Delivering
The second component of the equation is happier customers. And who determines whether customers are happy? The answer is simple: the customers themselves.
By empowering customers to identify and prioritize what matters most to them — and then delivering on those priorities — transit agencies can significantly increase satisfaction.
Ad Loading...
When customers are happy, they’re more likely to use the service and recommend it to friends and family.
While every community and rider are unique, national research consistently shows that the top three factors contributing to transit customer happiness are:
On-time performance
Frequency of service
Travel time
More Customers: A Shifting Landscape
The final part of the equation — ridership growth — comes last for a reason.
Nationally, the income level of a typical transit customer today is 14% lower than it was pre-COVID. Remote work is the primary driver of this shift. More affluent commuters, who once relied on transit, now work from home at least part of the week. This change has reduced overall transit ridership by 40%.
Ad Loading...
However, these individuals are still customers — they just use the system less frequently. It’s similar to someone trying to cut back on coffee: they might visit Dunkin’ less often, but they’re still loyal customers.
The Real Metric of Success
Rather than obsessing over increasing ridership — a metric that fascinates only the transit industry — we should listen to the 80% of community members who already see value in their public transportation system, regardless of how often they use it.
Consider this: doubling ridership might mean serving just 6% to 7% of the community instead of 3% to 4%.
But what if we focused on delivering value and creating more satisfied customers instead? Wouldn’t that serve our communities better?
The choice is clear: we must prioritize what truly matters — delivering value, creating happier customers, and ultimately making transit an indispensable part of our communities.
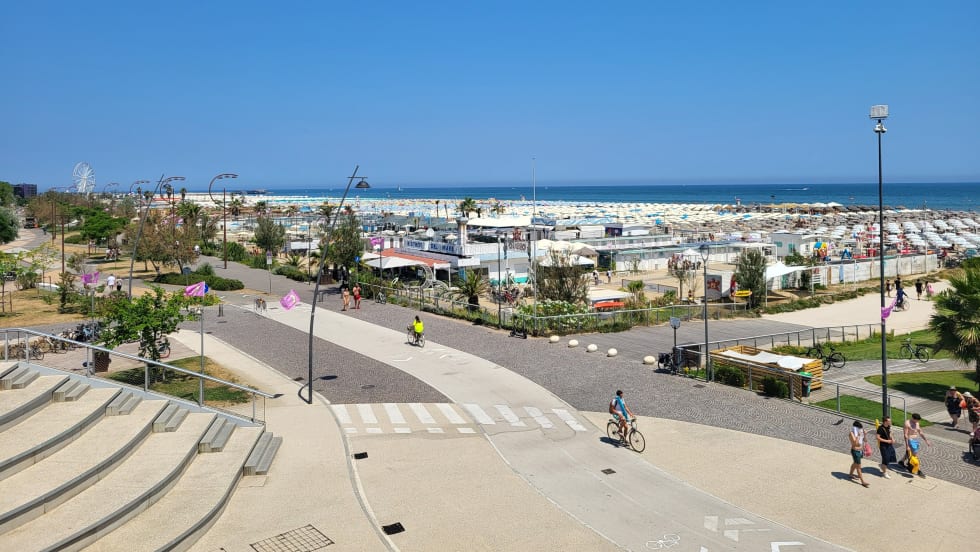
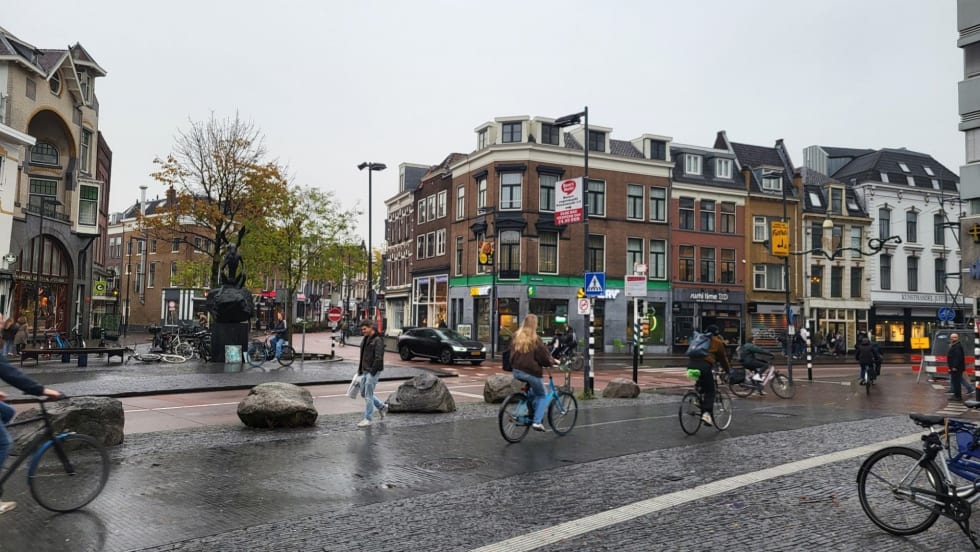
The global cycling conference highlighted how cities are integrating bicycles into multimodal transportation networks, expanding cycle tourism and reshaping urban mobility.
Mike Bismeyer — often known as “The Kindness Guy” — has spent more than 17 years in public transit and mobility, serving in industry leadership roles, speaking across North America, and advocating for stronger workplace cultures. But his message doesn’t come from theory. It comes from lived experience.
Transport leaders from around the world gathered in Leipzig, Germany, for the 2026 International Transport Forum to discuss resilience, climate impacts, supply chains and the future of sustainable mobility.
Polis comprises cities and regions, as well as corporate partners, from across Europe, promoting the development and implementation of sustainable mobility. This year’s event had over a thousand attendees across various policy forums and an exhibition.
Across North America and beyond, transit agency officials are contending with a perfect storm of operational headaches and strategic challenges that hamper daily service and long-term progress.
Simply incentivizing electrification is not enough to make a meaningful impact; we must shift our focus toward prioritizing public transportation and infrastructure.
For many years, the narrative surrounding public transit improvements has been heavily weighted toward environmental gains and carbon reduction. While these are undeniably crucial long-term benefits, the immediate focus of this new funding environment is firmly on demonstrable system efficiencies and a clear return on investment.