



Keep Reading: A Structured Approach to Transit Maintenance
What Multimodal Data Can Tell Transit Agencies About Rider Demand
See how bike-on-bus data is giving transit agencies new insight into rider demand, capacity constraints, and gaps in first- and last-mile connections.
September 22, 2026
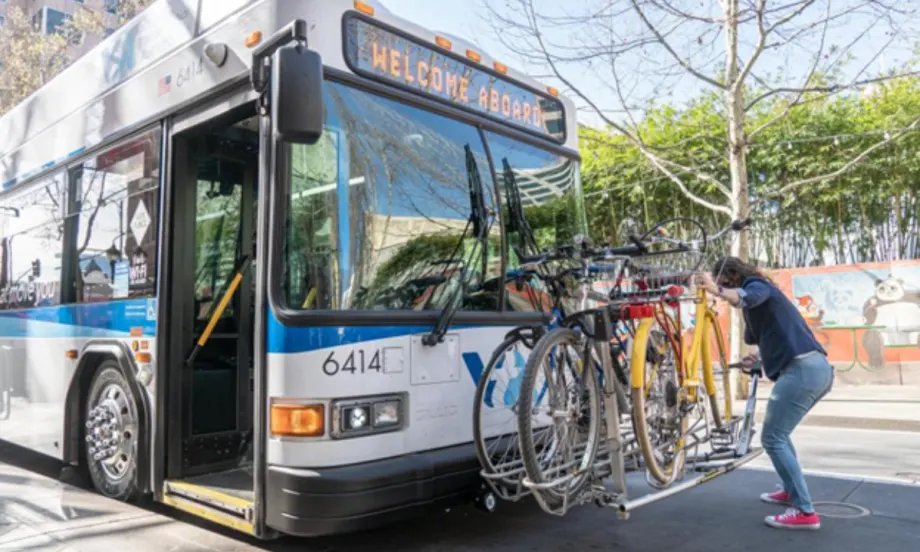
Tracking bike-on-bus activity can help transit agencies better understand multimodal travel patterns, capacity needs, and first- and last-mile connections.
Credit:
Santa Clara Valley Transit Authority (VTA)
7 min to read
- Transit agencies are leveraging bike-on-bus data to gain insights into rider demand and improve service efficiency.
- This data helps identify capacity constraints, allowing agencies to allocate resources more effectively.
- Analyzing this information highlights first- and last-mile connection gaps, aiding in the development of comprehensive transit solutions.
*Summarized by AI
Every hour, on average, more than 1,000 North American transit riders board a bus with a bicycle. Over a year, that adds up to an estimated 9.1 million bike-on-bus trips.
Yet many transit agencies still have a limited view of those trips. For example, where they happen, when demand peaks, and how often bike racks reach capacity.
A new white paper from WSP in the U.S. and Sportworks, “Making Multimodal Mobility Visible”, explores that gap through pilot programs with the Santa Clara Valley Transportation Authority (VTA) and San Diego Metropolitan Transit System (SDMTS).
What could they do differently if they understood not just how many people ride transit, but how those riders connect to it?
A Blind Spot in the Rider Journey
Since transit agencies routinely measure ridership, on-time performance, and service reliability, bike-on-bus activity can be harder to see.
Some agencies don't track cycling ridership, while others rely on manual observations or operators recording when a rider loads a bike. Those tactics provide individual snapshots rather than a continuous picture of demand, according to April Johnson, general manager at Sportworks, and Yizhou Chen, VP, digital and growth at Sportworks.
The difference between those snapshots and actual use can be substantial. At one transit agency, automated counts found bike-rack usage was 80% higher than manual operator counts had indicated. Missing information like this is important because a transit trip is rarely just the time a passenger spends aboard a vehicle.
Armon Keshmiri, fleet technology consultant, and Maria Signes-Costa Smith, associate consultant, at WSP in the U.S., said agencies need to consider how well the entire transportation network supports a rider's journey, including getting to transit and completing the last mile.
"The value of transit doesn’t exist in isolation," Keshmiri and Signes-Costa said.
For cyclists, understanding that journey could show agencies where bike parking is needed, where rack capacity is strained, and where a transit connection may be filling a gap elsewhere in the transportation network.
However, the challenge isn't necessarily a lack of data. Transit agencies already collect large volumes of information across their operations. The harder task is connecting those datasets in a way that helps planners and operators make decisions.
Keshmiri and Signes-Costa distinguish a data-rich agency from a data-driven one by how effectively information makes its way into decision-making. Fragmented or difficult-to-access data has limited value even when an agency has plenty of it.
Bike counts, for example, become more useful when viewed alongside passenger counts, route frequency, time of day, and instances when racks reach capacity. That type of data can reveal not only that cyclists are using a route, but when their demand is highest and whether available capacity is keeping pace.
"Data-rich agencies have the numbers. Data-driven agencies have turned those numbers into something that can be acted on immediately," Johnson and Chen said.
Identifying the difference becomes important when agencies face decisions about where to put limited resources.
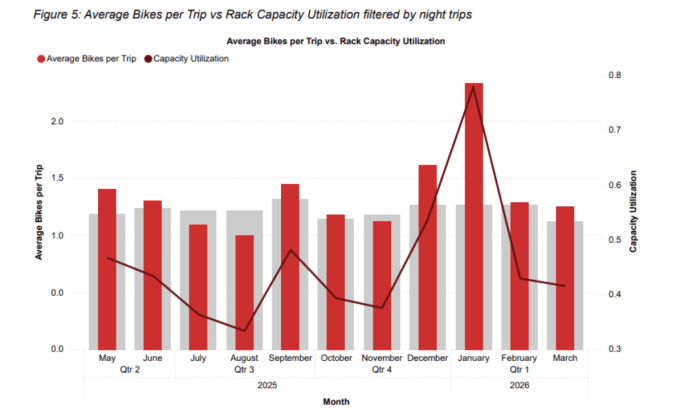
SDMTS data compares the average number of bikes carried per trip with bike-rack capacity utilization during nighttime service, helping illustrate when bicycle demand is more likely to strain available capacity.
Credit:
WSP in the U.S. / Data from the San Diego Metropolitan Transit System (SDMTS)
Planning Around the Complete Trip and Capacity Problems
Over the next five to 10 years, Keshmiri and Signes-Costa expect multimodal data to help shift planning from individual modes and historical demand toward complete journeys and actual travel patterns.
The SDMTS pilot identified specific routes, stops, and periods with particularly high bike-rack utilization. That level of detail can help an agency determine whether additional capacity, bike parking, or other multimodal infrastructure would have the greatest benefit.
It could also allow agencies to respond more precisely to changes in demand.
Johnson and Chen pointed to seasonal "bike buses" as one example. Agencies could remove seats to provide more bicycle capacity during periods when cycling demand increases, then restore them during other parts of the year, but making that strategy work requires knowing which routes experience those swings and when they occur.
The implications extend to vehicle procurement too. Instead of relying primarily on general assumptions or minimum requirements when deciding how much space to provide for bikes or mobility devices, agencies could use route-level information about their actual rider mix to inform vehicle configurations.
"If an agency can see, route by route, how many riders are boarding with bikes versus wheelchairs versus strollers, capital planning stops being a guess and starts being a spec," Johnson and Chen said.
The same information could inform investments outside the bus, including bike parking, racks at stops, bike lanes, and paths, and it could help someone planning a trip know whether space for a bicycle is available before the bus arrives.
For agency purposes, the longer-term value comes from accumulating enough information to identify patterns.
Combining multimodal demand with weather, time of day, historical travel patterns, and major events could help agencies anticipate where capacity constraints are likely to emerge. Instead of discovering a recurring problem after racks are already full, an agency could adjust service, move resources, increase rack capacity, or communicate with riders earlier.
"The bigger opportunity is using historical patterns to see it coming," Johnson and Chen explained, describing how agencies must soon shift how they use information.
Cycling demand isn't static. It can change with daylight, temperature, school calendars, and local events. Building a history of those changes could help agencies plan seasonal capacity before demand rises rather than reacting after riders begin encountering limited rack space.
Putting Multimodal Data to Work During Major Events
That ability to see changing travel patterns could be especially useful during major events, like the recent FIFA World Cup or upcoming 2028 Summer Olympic and Paralympic Games.
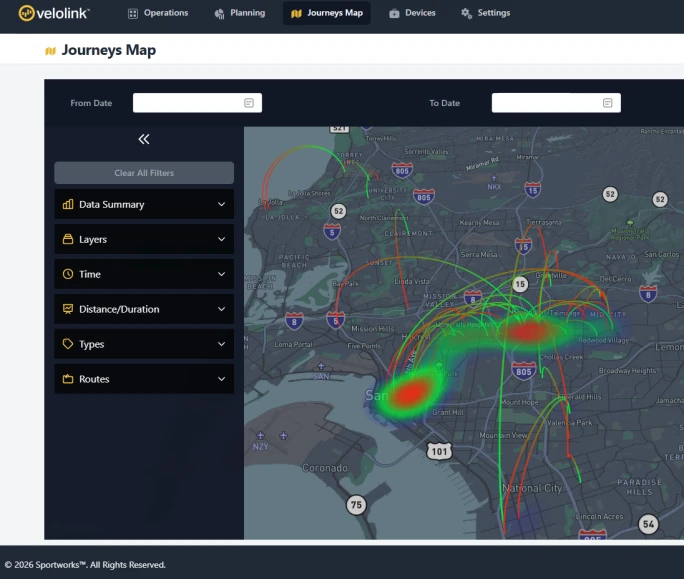
Sportworks’ Velolink dashboard gives transit agencies visibility into bike-on-bus activity, helping them track where and when bicycles are being carried and identify patterns in multimodal demand.
Credit:
Sportworks
In the pilots discussed in the white paper, Velolink captured real-time bicycle counts at the point of use. The information gave agencies visibility into where and when bikes were being used with transit, which could inform decisions about capacity, service, and customer communications.
Johnson and Chen said Velolink data is being integrated into General Transit Feed Specification (GTFS)-Realtime, allowing bike availability to appear in the trip-planning tools riders already use.
That kind of data feature takes on added importance when a major event brings visitors who don't know the system. Rather than expecting an unfamiliar rider to know which services are likely to be crowded, agencies could make capacity information available during trip planning and potentially distribute demand toward services with room available.
The Paris 2024 Summer Olympics offered another example, combining dedicated cycling infrastructure, temporary secure bike parking, and real-time information. For events such as the 2028 Olympics, Keshmiri and Signes-Costa see an opportunity to pair real-time information with temporary infrastructure to respond to event-specific travel needs without necessarily making permanent changes across the network.
When High Bike Demand Signals Something Else
One of the more interesting uses of multimodal data is when it challenges the obvious interpretation of the numbers.
VTA's "Wheels on the Bus" project found high bike-rack utilization concentrated along a short segment of a bus trip. On its face, that might suggest a route that simply needs more bicycle capacity, but Johnson and Chen said the geography showed cyclists used the bus to cross a freeway where safe bicycle infrastructure didn't exist. In effect, the bus was serving as a bridge.
This new information then changes the planning question. Adding rack capacity or increasing frequency could improve the existing workaround. A bike or pedestrian bridge, protected crossing, or shared-use path could instead address the barrier causing cyclists to use the bus for that short segment in the first place.
"Utilization data alone answers 'how much,'" Johnson and Chen said.
Understanding why the utilization is concentrated in one place can tell an agency whether it is looking at demand for transit capacity or evidence of a missing transportation connection.
With that in mind, agencies could avoid assuming that a large capital investment is always the answer. Keshmiri and Signes-Costa said multimodal data may reveal that what appears to be a transit-capacity problem actually stems from poor pedestrian access, inadequate bike parking, or an unreliable connection between modes. In those cases, a smaller and more targeted intervention may address the underlying problem more effectively.
Start With the Problem, Not the Technology
For agencies just beginning to collect multimodal data, the first step isn't necessarily buying another technology platform. Keshmiri and Signes-Costa recommend starting with the questions an agency wants its data to answer, then establishing the people, processes, departmental roles, and data-quality practices needed to use that information.
Working on this approach also requires agencies to reconsider what can serve as a source of useful operational information.
"A bike rack isn't just a rack, it's an unused source of data," Johnson and Chen said.
Tracking when and where that rack is used, and connecting those events to routes, times, and trips, can make a part of the bus that has traditionally carried bicycles also help explain how riders navigate the larger transportation network.
Subscribe to Our Newsletter
More New Mobility

From Hardware to Digital Partner: Luminator Charts Its Next Chapter
CEO Magnus Friberg discusses Luminator’s shift toward becoming a digital partner, the growing importance of software and interoperability, and how AI can help agencies improve operations and passenger experience.
Read More →
Biz Briefs: Alstom Lands Canadian Contract, LYT to Supply California TSP, and More
In METRO's latest installment, we take a look at recent news from Complete Coach Works, Beep, FlixBus, and more partnerships making headlines across the transportation sector.
Read More →
CharterUP’s Armir Harris on Technology, AI, and the Future of Group Mobility
In a recent episode of METROspectives, CharterUP Founder/CEO Armir Harris discussed the company’s evolution from an online charter bus marketplace into a technology platform supporting public- and private-sector mobility and much more.
Read More →
Jacksonville’s NAVI Project Charts a New Course for Autonomous Public Transportation
Through its NAVI program, JTA is showing how autonomous vehicles, intelligent infrastructure, and coordinated operations can work together to deliver everyday public transportation.
Read More →
Biz Briefs: Luminator Marks Milestone and More
From manufacturers and suppliers to transit agencies and motorcoach operators, these updates offer a snapshot of the projects, partnerships and business moves driving the industry forward.
Read More →
New Tricks for Old Bureaucracies: Joshua Schank on Making Transit Innovation Stick
Former LA Metro Chief Innovation Officer Joshua Schank discusses why good ideas aren't enough, how transit agencies can overcome resistance to change, and why today's challenges demand more innovation.
Read More →
How DART's GoPass Is Redefining Regional Mobility
Serving 14 transit agencies, GoPass simplifies multimodal travel by allowing riders to plan, pay for, and manage an entire trip through one app.
Read More →
Biz Briefs: OCTA Taps Clean Energy for Hydrogen Station, Stadler to Supply Via Rail Vehicles, and More
From manufacturers and suppliers to transit agencies and motorcoach operators, these updates offer a snapshot of the projects, partnerships and business moves driving the industry forward.
Read More →CharterUP Expands Into New Mobility and Autonomous Transportation
Vice President of New Mobility Stephen Joos discusses how CharterUP is leveraging its nationwide transportation network, technology platform, and autonomous vehicle partnerships to expand into workforce mobility, campus shuttles, and transit solutions.
Read More →
METRO Magazine Announces 2026 Innovative Solutions Awards Winners
Projects Recognized for Advancing Mobility Through Technology, Accessibility, Workforce Innovation, and Operational Excellence
Read More →